Trust in Political Science Research
Experiment
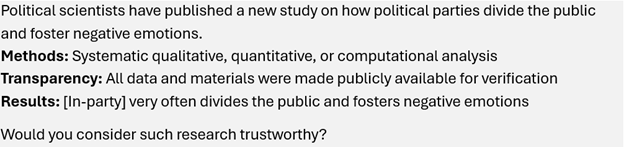
Example Vignette
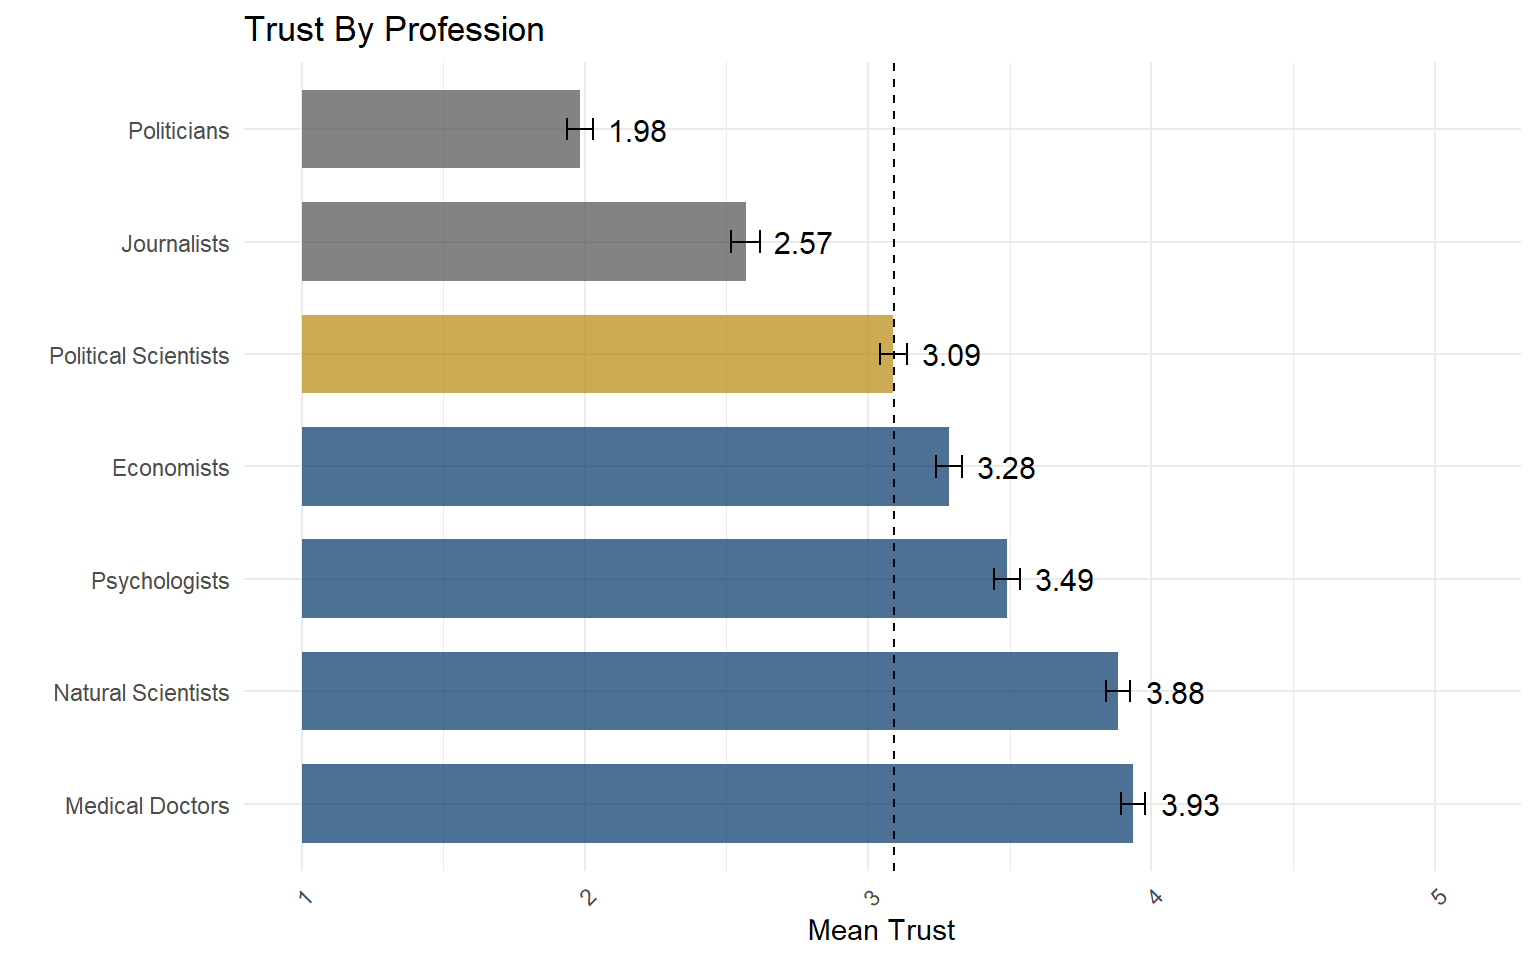
Trust in Political Scientists
Research Practices

Average Marginal Component Effects
References
![]()
Cologna, Viktoria, Niels Mede, Sebastian Berger, et al. 2025. “Trust in Scientists and Their Role in Society Across 68 Countries.” Nature Human Behaviour 9 (4): 713–30. https://doi.org/10.1038/s41562-024-02090-5.
Desch, Michael. 2019. Cult of the Irrelevant: The Waning Influence of Social Science on National Security. Princeton University Press.
Eberle, Jakub, Hubert Smekal, Petr Ocelík, and Oldřich Krpec. 2021. “Political Science in Central and Eastern Europe: Integration with Limited Convergence in Czechia.” European Political Science 20 (1): 183–203. https://doi.org/10.1057/s41304-020-00311-9.
Gauchat, Gordon. 2012. “Politicization of Science in the Public Sphere: A Study of Public Trust in the United States, 1974 to 2010.” American Sociological Review 77 (2): 167–87. https://doi.org/10.1177/0003122412438225.
Gligorić, Vukašin, Gerben van Kleef, and Bastiaan Rutjens. 2024. “How Social Evaluations Shape Trust in 45 Types of Scientists.” PLOS ONE 19 (4): e0299621. https://doi.org/10.1371/journal.pone.0299621.
Gross, Neil. 2013. Why Are Professors Liberal and Why Do Conservatives Care? Harvard University Press.
Grossmann, Matt. 2021. How Social Science Got Better: Overcoming Bias with More Evidence, Diversity, and Self-Reflection. New York: Oxford University Press. https://doi.org/10.1093/oso/9780197518977.001.0001.
Havlík, Vlastimil, Damir Kapidžić, and Magdalena Solska. 2025. “Methods in Political Science Journals in ‘Eastern’ Europe: Catching up with the ‘West’.” In The Application of Political Science Methods in Europe: A Multifaceted Dilemma, edited by Luca Verzichelli and Claudius Wagemann, 29–47. Cham: Springer Nature Switzerland. https://doi.org/10.1007/978-3-031-93841-2_2.
Nosek, Brian, Tom Hardwicke, Hannah Moshontz, Aurelien Allard, Katherine Corker, Anna Dreber, Fiona Fidler, et al. 2022. “Replicability, Robustness, and Reproducibility in Psychological Science.” Annual Review of Psychology 73 (1): 719–48.
Schneider, Jesper, Nick Allum, Jens Andersen, et al. 2024. “Is Something Rotten in the State of Denmark? Cross-National Evidence for Widespread Involvement but Not Systematic Use of Questionable Research Practices.” PLOS ONE 19 (8): e0304342. https://doi.org/10.1371/journal.pone.0304342.
Schulman, Jonathan, James N Druckman, Alauna Safarpour, Matthew A Baum, Katherine Ognyanova, Kristin Lunz Trujillo, Alexi Quintana Mathé, et al. n.d. “Continuity and Change in Trust in Scientists in the United States: Demographic Stability and Partisan Polarization.” Public Opinion Quarterly, nfaf059. https://doi.org/10.1093/poq/nfaf059.
Torreblanca, Carolina, William Dinneen, Guy Grossman, and Yiqing Xu. 2025. “The Credibility Revolution in Political Science.” OSF Preprints. 2025. https://doi.org/10.31235/osf.io/w2kmc_v1.
Van de Werfhorst, Herman. 2020. “Are Universities Left-Wing Bastions? The Political Orientation of Professors, Professionals, and Managers in Europe.” The British Journal of Sociology 71 (1): 47–73.